⚛️ FLUXMATERIA — CHEMISTRY
Eight spectroscopy types,
one physics engine
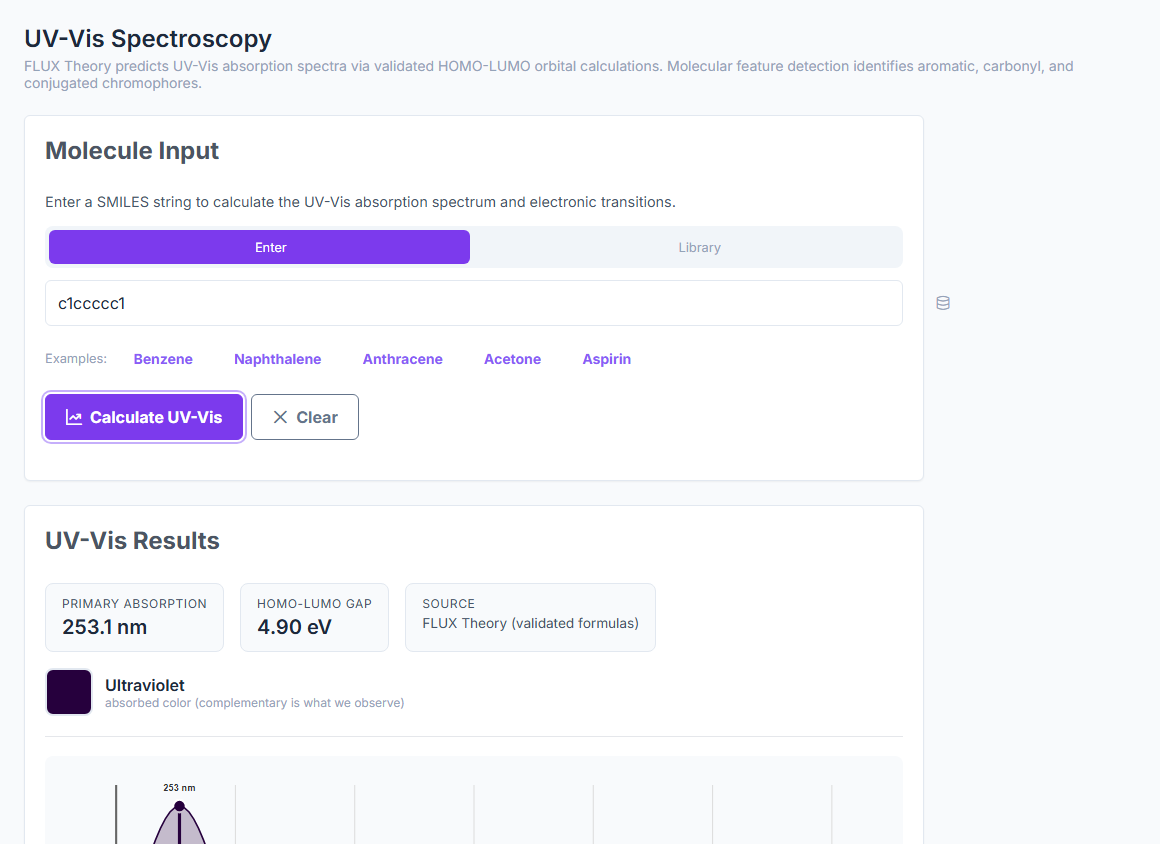
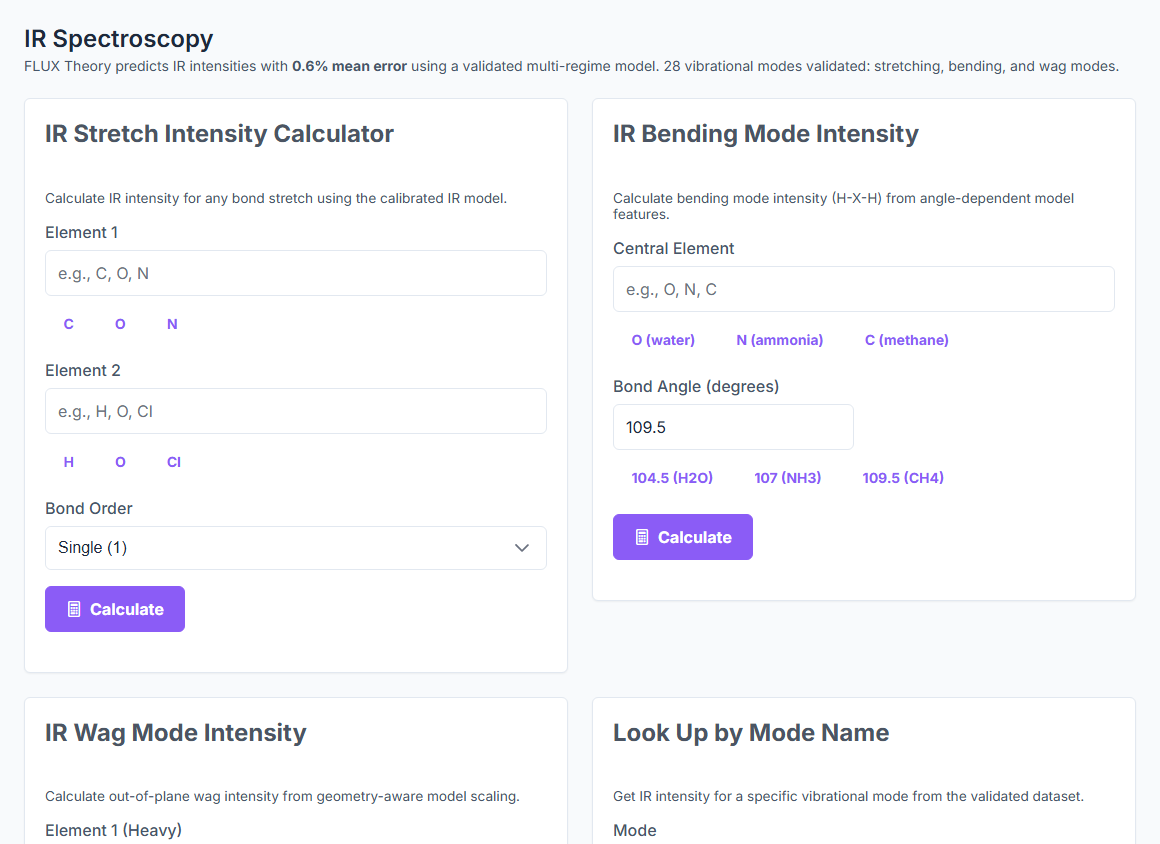
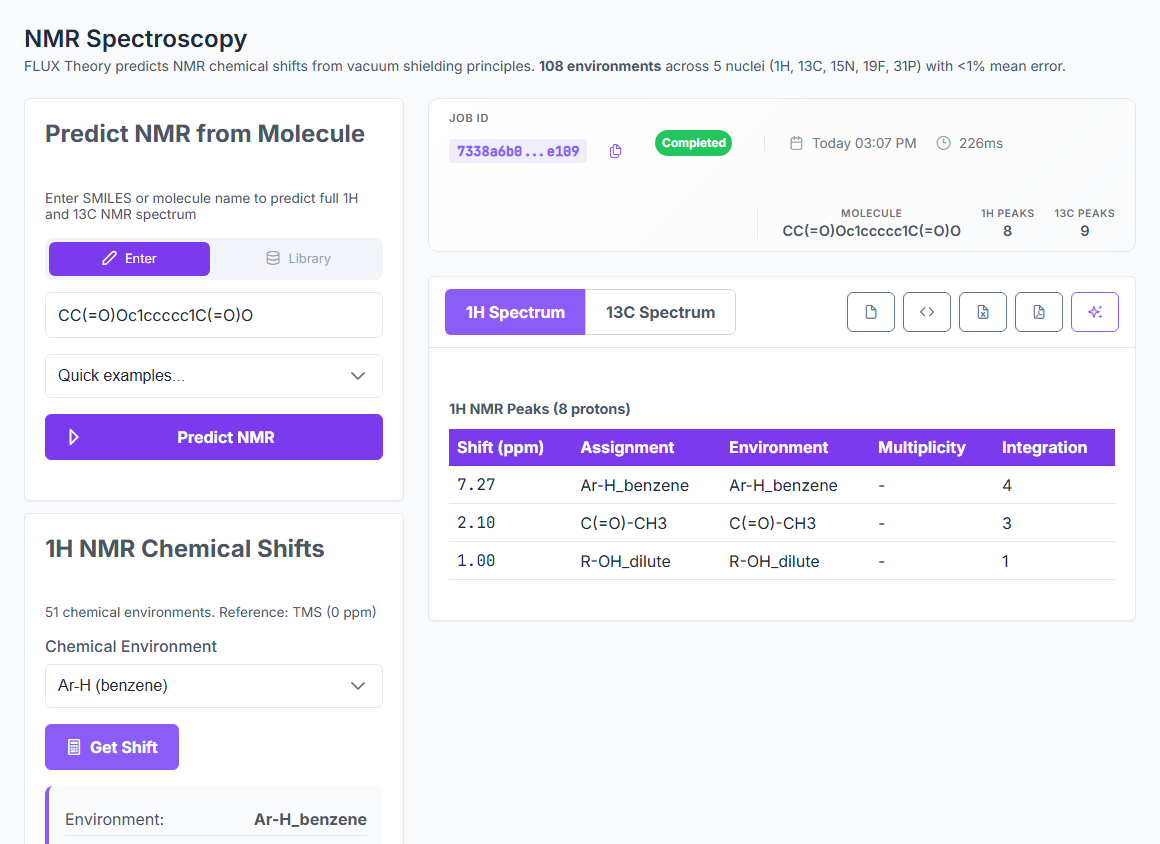
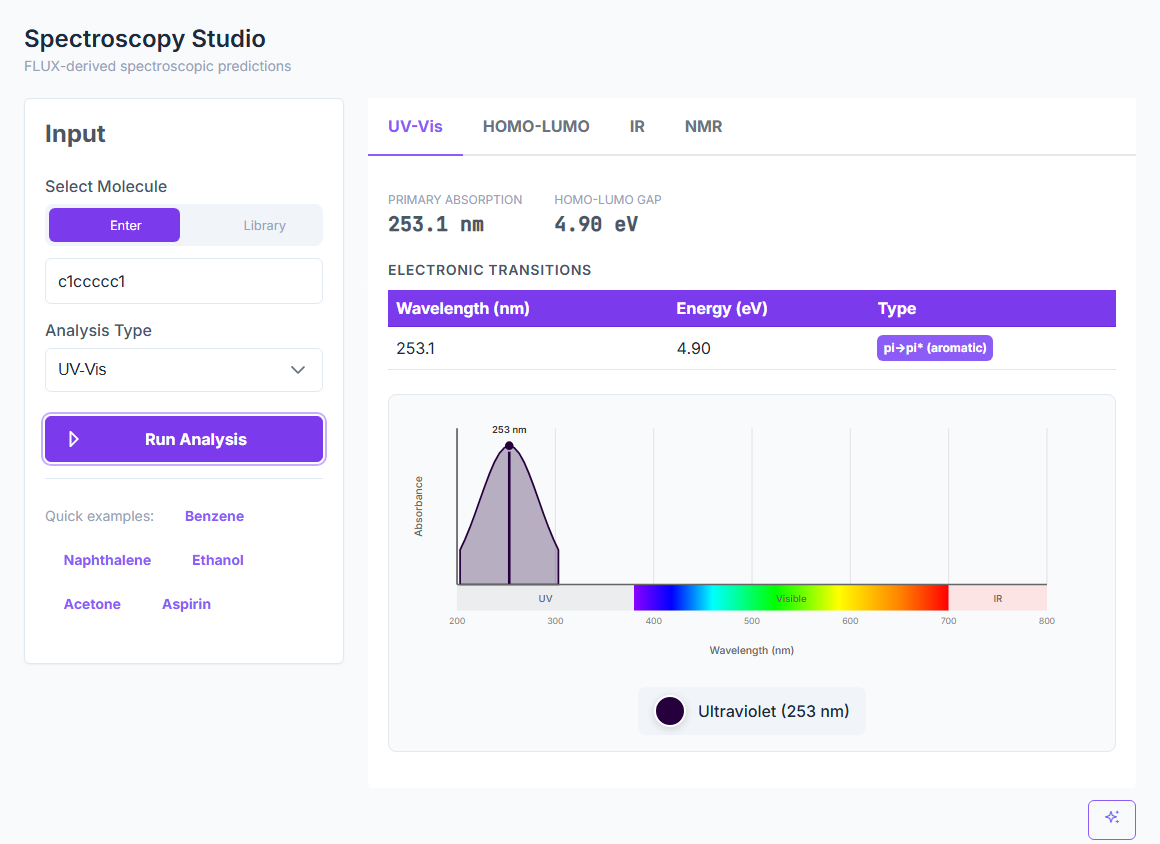
Predict UV-Vis, IR, NMR, Raman, CD, EPR, Emission, and X-ray spectra from a SMILES — with peak assignments and confidence indicators. UV-Vis at 6.2% error, IR inside 1%, NMR at 0.3–0.5 ppm MAE. ~25 ms per prediction.
UV-Vis
IR / Raman
NMR
CD / EPR / X-ray
Peak assignments
8
Spectroscopy types from one engine
6.2%
UV-Vis mean error on 50 molecules
< 1%
IR mean error on 32 NIST molecules
0.3–0.5
NMR MAE (ppm) on 10 SDBS molecules
~25 ms
Per prediction on a single CPU