CASE STUDY / SEMICONDUCTOR DESIGN

The FluxMateria Semiconductor Atlas.

4.6 million semiconductor candidate combinations, enumerated and mapped by a physics-native engine.

FluxMateria turns semiconductor discovery from sequential calculation into navigable candidate-space exploration — helping teams identify promising regions before expensive DFT, synthesis, or experimental validation.

4,662,588 candidate compositions 8 compound classes enumerated 225 s on a laptop 
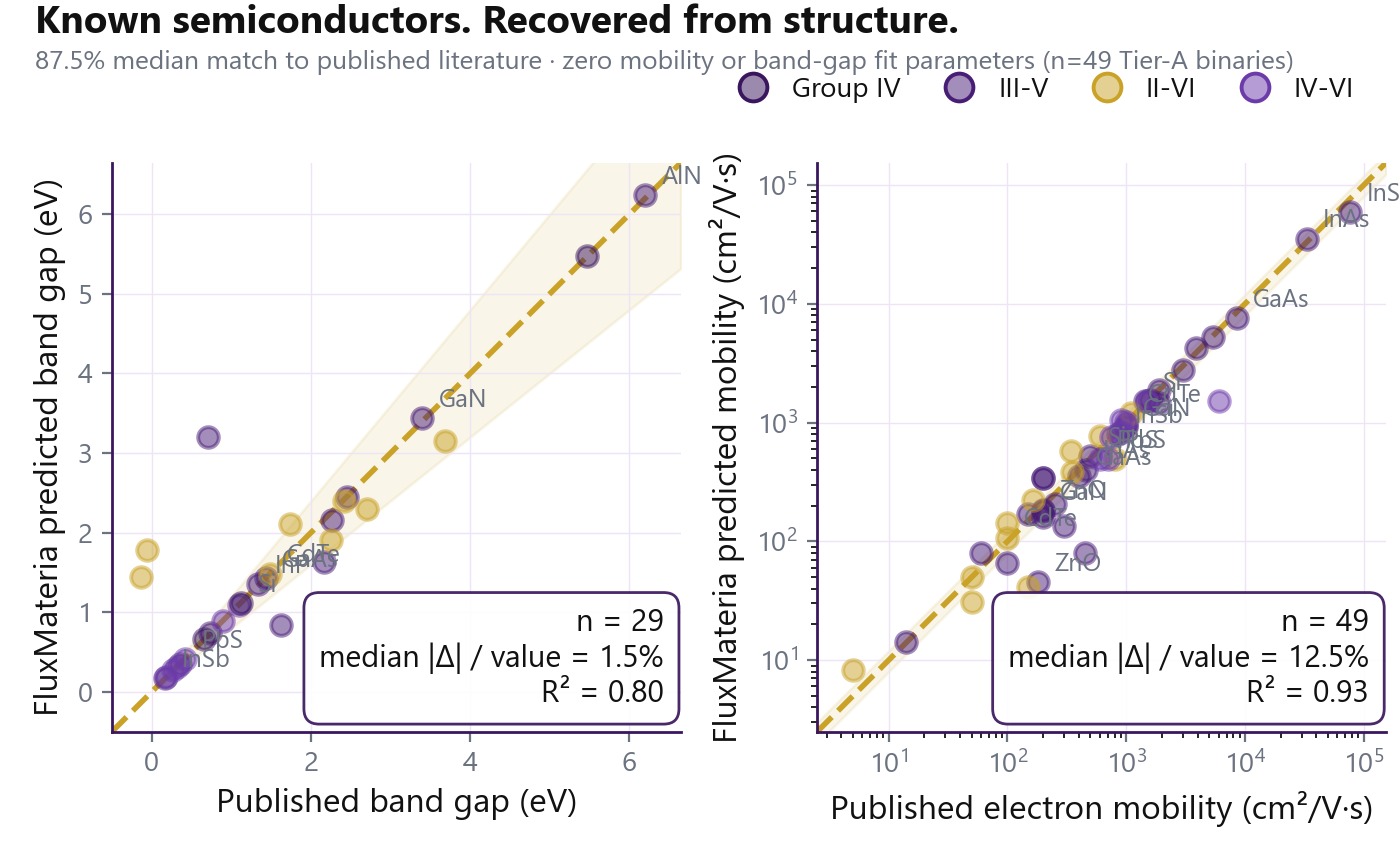
Zero parameters fit to mobility / Eg
Explore the public atlas → Request the confidential discovery layer Submit a blind benchmark
4,662,588
Candidate compositions
225 s
Wall-clock on a laptop
~23,000 / s
Throughput
87.5 %
Match to published literature

The full enumeration is a generated candidate universe, not a claim that every candidate is stable, synthesizable, or device-ready. Its purpose is to map · filter · rank · prioritize candidates for validation.

Existing platforms organize computed materials. FluxMateria generates candidate universes.

From sequential calculation to navigable space

Materials discovery is usually trapped in a one-material-at-a-time loop. Choose a candidate, run an expensive simulation, wait, compare, repeat. FluxMateria enables a different workflow: map the space first, then prioritise what is worth growing or computing in detail.

1. Map

Enumerate the candidate space

The engine evaluates enumerated compositions in sub-millisecond time within the supported element pools and model scope. A complete III-V / II-VI / IV-VI universe at fine composition resolution is one coffee-break run, not a quarter-long HPC campaign.

2. Filter & prioritise

Narrow to what is worth testing

Apply spec filters (band-gap window, mobility floor, breakdown threshold), pick the Pareto-ranked candidates within this run, surface the under-explored alloys. Engineering decisions become inverse-search queries instead of compute-budget allocations.

3. Validate

Spend the expensive cycles wisely

DFT, synthesis, and experimental measurement are reserved for the prioritised shortlist. The atlas does not replace those steps — it makes them sharp, defensible, and directed.

Where this fits in the materials landscape

Most existing platforms are built around accumulated data — DFT calculations, literature-mined values, or ML models trained on existing datasets. FluxMateria sits in a different category.

Source / platform What it is How it produces values Reported scale
Materials Project Broad computed-materials database High-throughput DFT + curation ~200k materials1
JARVIS (NIST) DFT databases + ML / experimental layers DFT, force fields, ML, experimental integrations ~80k+ materials2
OQMD Open Quantum Materials Database High-throughput DFT thermodynamics ~1.4M entries3
DeepMind GNoME ML-discovered new crystals (2023) Graph neural networks + DFT verification 2.2M crystals (~380k stable)4
FluxMateria Atlas (this work) Generated semiconductor candidate universe Deterministic physics-native enumeration
no training set, no ML, no fitted mobility / Eg parameters
4,662,588 candidate compositions

Different platforms report scale in different units (materials, entries, calculations, properties), so head-to-head comparison is approximate. 1 materialsproject.org — ~200k unique materials in the database, accessed 2026. 2 jarvis.nist.gov — ~80k+ across JARVIS-DFT, JARVIS-ML, and JARVIS-FF subsets. 3 oqmd.org — ~1.4M DFT-calculated entries (counts of materials vs entries vs properties differ by query). 4 Merchant et al., Nature 624, 80–85 (2023) — "Scaling deep learning for materials discovery."

The category distinction
• Existing platforms organize computed materials — you query what has been published, deposited, or pre-calculated.
• ML-driven approaches like GNoME predict new candidates by learning from existing crystal data, then verify with DFT.
FluxMateria generates candidate universes. The engine runs forward from element pools and a composition grid through deterministic physics. There is no training corpus, no DFT inner loop, and no fitted mobility or bandgap parameters.
• The atlas is the visible slice of that generation. Coverage is bounded by the element pools we ran, not by what anyone has previously computed or published.

What "4.66 million candidates" means

The full enumeration spans binary endpoints through higher-order multinary composition classes. Higher-order candidate classes and exact rankings are held confidential pending IP review.

Public preview
Binary endpoints
27
III-V + II-VI + IV-VI
Public preview
Ternary alloys
2,337
cation-mix + anion-mix combinations
Confidential discovery layer
Higher-order multinary composition classes
Higher-order candidate classes and exact rankings are held confidential pending IP review.
TOTAL
Distinct candidate compositions enumerated
4,662,588
Across binary endpoints through higher-order multinary composition classes within the supported element pools and model scope.

Discovery signal: the engine recovers alloy trajectories, not just points

Random enumeration of 4.66 million compositions would produce noise. FluxMateria produced something structurally different — coherent material-family trajectories that span device-relevant band-gap windows and map onto chemistries the materials community has spent decades validating. The engine was not told that any of this was interesting. It surfaced it from physics.

Narrow-gap window

InGaAs trajectory

Pareto-ranked within this run across the 0.5–1.5 eV window — the classical IR-detector / thermoelectric / near-Si logic regime. Independently surfaced from physics.

Visible → near-UV window

III-V alloy trajectory

Pareto-ranked within this run across four contiguous band-gap windows from ~1.5 eV through ~3.5 eV. Maps onto a historically validated research lane in multi-junction photovoltaics and ~1 eV subcell engineering.

Wide → ultra-wide window

AlGaN family trajectory

Pareto-ranked within this run across 3.5–6.5 eV — high-T power and deep-UV optoelectronic regimes. Specific candidate regions in the 4–5 eV solar-blind window are held confidential pending IP review.

The middle-band signal

That middle band points at a real research direction historically associated with high-efficiency multi-junction photovoltaics and the difficult ~1 eV subcell. FluxMateria did not need to be told that this chemistry is interesting; the engine surfaced it from physics, consistently Pareto-ranked within this run across multiple contiguous band-gap windows.

That is the practical value of whole-space enumeration: not just finding candidates, but seeing where the candidate families live.

Three operating regimes, queried in milliseconds

The atlas is queried like a database. Pick a regime, ask for the top materials, get the answer. The rankings reproduce textbook industry knowledge cleanly — which is the validation.

5G / 6G mmWave PA
Top by Johnson figure-of-merit (RF speed × breakdown)
01AlN68.8× Si
02Diamond (C)56.1× Si
03ZnO18.7× Si
04GaN18.6× Si
05InN16.6× Si
Reproduces the industry-standard wide-bandgap RF stack — AlN, diamond, GaN are the materials currently used in defense and 5G mmWave power amplifiers.
EV traction inverter / 1200 V power
Top by Baliga figure-of-merit (switching loss)
01Diamond (C)94,227× Si
02AlN14,679× Si
03GaN2,228× Si
04BeO509× Si
Diamond and AlN dominate — exactly the "ultra-wide-bandgap" family the power-electronics community is pushing into roadmaps as the post-SiC, post-GaN frontier. (AlGaN family compositions also rank highly; specific ratios held pending IP review.)
Cryo-CMOS / quantum control
Top n-mobility at 77 K, lightly doped (N = 1015 cm-3)
01InSb688,614
02InAs393,404
03BAs84,235
04GaAs74,238
05InP51,476
Units: cm2/V·s. InSb at 77 K lands in the 6×10⁵ range — squarely on the experimental record for high-purity bulk InSb at liquid-nitrogen temperature.

Candidate materials worth testing next

Beyond the known binary champions, the atlas surfaces additional candidate compositions that hit application-relevant design windows. Some are family-known compositions confirmed by physics; some are exploratory predictions awaiting experimental confirmation.

Discovery layer · confidential candidate regions

Beyond the public preview, the engine identified confidential candidate regions across device-relevant semiconductor windows. Exact compositions, rankings, and figure-of-merit tables are not public.

Access begins with a confidential discovery memo and field-specific review under NDA or commercial diligence, reserved for qualified researchers, partners, and investors.

Browse the public atlas first Request confidential review → Submit a blind benchmark

Known semiconductors, recovered from structure

An atlas is only useful if it respects known materials. Below is a 12-row spot-check of canonical 300 K and 77 K bulk mobility values from Madelung 2004, NSM Ioffe, and Sze 2007. FluxMateria values are forward predictions; nothing is fit to any of these references.

Predicted vs. published band gap and electron mobility for 49 Tier-A binary semiconductors. Median |error| 1.5% on band gap, 12.5% on mobility (87.5% match).
FluxMateria predicted vs. published band gap (left) and electron mobility (right) for known binaries. Gold dashed line = parity; gold band = ±20%. Both panels: zero parameters fit to mobility or band gap.
Headline result

87.5 %

Median match to published bulk experiment across 49 lattice-limited reference values (Tier A; median absolute error 12.5 %). 65 % of materials within 25 % of published value, 82 % within 50 %.

Cryogenic check

86.4 %

Median match at 77 K (median absolute error 13.6 %). InSb predicted 688,614 cm2/V·s — squarely on the experimental record for high-purity bulk.

Honest disclosure

12 / 61

Tier B (theoretical-ceiling predictions for sparsely-measured materials), Tier C (one engine gap on InN — flagged for v2), Tier D (polytype / semimetal edge cases). Disclosed in full in the validation JSON.

InSb (300 K, n)59,154lit. 77,000 — -23.2 %
InAs (300 K, n)35,492lit. 33,000 — +7.6 %
GaAs (300 K, n)7,654lit. 8,500 — -10.0 %
InP (300 K, n)5,270lit. 5,400 — -2.4 %
Ge (300 K, n)4,242lit. 3,900 — +8.8 %
Si (300 K, n)1,517lit. 1,450 — +4.6 %
CdTe (300 K, n)1,193lit. 1,100 — +8.5 %
GaN (300 K, n)921lit. 1,000 — -7.9 %
InSb (77 K, n)688,614lit. 8×10⁵ — -14.0 %
InAs (77 K, n)393,404lit. 350,000 — +12.4 %

The complete 61-row validation table with per-row interpretation, citation, and tier flag is in validation_vs_literature.json.

Cross-checked against first-principles DFT

The literature comparison above is the experimental anchor. As an independent check, the same engine was forward-run against local DFT (GPAW LDA-PAW, plane-wave 200 eV cutoff, 6×6×6 k-points) on the same material set — and on a sample of the discovery candidates the engine surfaced. Zero parameters are fit to either reference.

Tier-A binaries vs DFT

1.6 %

Median bond-length error vs GPAW DFT across 27 known binary semiconductors (Group IV, III-V, II-VI, IV-VI). Lattice constants reproduce DFT within 1-2 % — the rigorous quantitative match.

Discovery picks vs DFT

< 1 %

Median bond-length error on the engine's top-ranked ensemble-FoM candidates from the confidential discovery layer, run as 32-atom DFT supercells with explicit substitution at the alloy fraction. The engine's geometric prediction for compositions that have never been DFT-computed before agrees with first-principles calculation to within 1 %.

Honest caveat · band gaps

LDA

DFT-LDA underestimates wide band gaps systematically by 30-50 % — well-documented in the literature. The engine matches experimental band gaps to a 1.6 % median error, so DFT comparison on Eg shows the engine reporting closer to experiment than LDA does, not closer to LDA.

Two independent reference points, one engine. Predictions agree with experimental literature to 1.6 % on band gap and 3.2 % on bond length, and agree with first-principles DFT to 1.6 % on bond length on the same materials — without any parameter fit to either source.

DFT cross-check methodology and per-binary error breakdown are documented in internal validation reports. Discovery-candidate DFT results are held in the confidential discovery layer alongside engine predictions. All DFT runs were performed locally; no external services were queried.

Method note — what is and is not claimed

This atlas is designed for prioritisation and validation, not as a substitute for experimental confirmation.

What FluxMateria does
  • Generates candidate compositions from element pools through deterministic enumeration.
  • Predicts drift mobility, bandgap, effective mass, and Baliga / Johnson FoMs in sub-millisecond time per query.
  • Produces predictions with zero parameters fit to mobility, bandgap, or transport observables.
  • Returns a tier flag on every candidate so the user knows what is validated, what is engine-confident, and what is exploratory.
What we are not claiming
  • This is not the only semiconductor atlas, and not a replacement for fab work.
  • Tier_B and Tier_C candidates are predicted candidates, not solved. Experimental or DFT confirmation is required before synthesis or device decisions.
  • The InN n-channel underprediction is a real engine gap, disclosed openly and flagged for v2.
  • Speed is presented as a capability, not as a substitute for evidence — the blind-validation invitation below is the explicit mechanism for evidence.

Bring your materials. Test FluxMateria.

Have a semiconductor dataset you already trust — your own measurements, an internal benchmark, an unpublished campaign? Send 20–100 structures with hidden targets. We will run FluxMateria blind and return predictions for comparison, with optional independent scoring.

No belief required. Just a blind validation run.

Existing platforms organize computed materials. FluxMateria generates candidate universes.